

Puzzles in the Pattern of Plague
/
This past weekend, my husband and I attended a lecture at my university on ‘Puzzles in the Pattern of Plague’. Being an infectious diseases specialist in my day job, and having talked about plague a number of times on the blog, the topic really caught my attention. As my husband is also a science geek, he good naturedly tagged along.
The talk was about using mathematical modeling of historic plagues to be able to predict future epidemics. And before you starting thinking Ugh, math… it was a very down to earth talk without a smidge of calculus (though you know for a fact that this kind of modelling overflows with calculus in the background), so it was fascinating from both a historical and scientific viewpoint. We’ll come back to a modern standpoint at the end as we touch on SARS and what the outbreak in 2003 might have meant for humanity.
Dr. David Earn, a mathematician at McMaster University, was the evening’s speaker. He focused on plague—bubonic, septicemic, and pneumonic—with an emphasis on the Great Plague of London from 1665.
There have been multiple waves of plague over the past two millennia:
- Justinian, starting in 541CE and lasting 200 years.
- Black Death (which includes the Great Plague of London), originating in China in 1334 and lasting more than 350 years, finally ending in the late 1600’s after killing over 60% of Europeans.
- Modern plague, which started in China in 1860 before spreading to kill 2–10 million worldwide, but which finally enabled scientists of the day to isolate the responsible bacterial agent, Yersinia pestis (Y. pestis).
There are three main forms of plague known to modern man:
- Bubonic plague—an infection of the lymphatic system by Y. pestis leading to swollen lymph nodes, or buboes. If untreated (as it was historically), the death rate is approximately 66%. Treated with modern antibiotics, the death rate is approximately 11%.
- Pneumonic plague—a Y. pestis infection that spreads to the lungs resulting in pneumonia. Untreated, the death rate approximates 100%. Surprisingly, even with modern antibiotics, the death rate is still nearly 100%. This is the kind of plague that defense experts worry about as a bioterrorism threat. There is a vaccine, but it is extremely inefficient.
- Septicemic plague—a Y. pestis infection which enters and spreads via the circulatory system leading to blackened and gangrenous extremities. The death rate from septicemic plague falls between that of bubonic and pneumonic plagues, but tends to approximate that of pneumonic plague even with modern treatment.
When it comes to identifying the type of plague through the ages, historians have no choice but to fall back on records of the time, which are often vague, and mostly date after the Justinian plague. However, it is clear that at least part of the second wave of plague was likely partially septicemic since it was known at the time as the Black Death, a reference to the black fingers and toes resulting from the systemic infection.
Considering the differences in plague properties, how can we be sure that the Justinian, Black Death, and modern plagues were caused by the same modern Y. pestis agent? Another McMaster researcher, Dr. Hendrik Poinar, has sequenced ancient DNA found in plague victims from both of these epidemics and has confirmed that Y. pestis was responsible for both.
So how does mathematical modelling help us use plagues of the past to possibly save us during a plague of the future? Information is power, and, in this case, knowledge of previous pandemics can help us design better control strategies for the next pandemic. This paradigm could instruct future scientists and healthcare professionals how to interrupt an epidemic just as it starts, possibly saving millions of lives in the process.
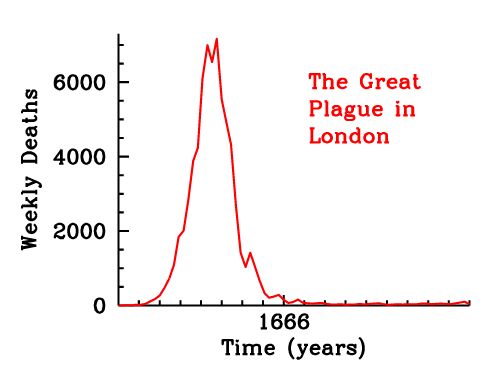
Toward this end, Dr. Earn and his students examined the Great Plague of London of 1665. They went back to the weekly bills of mortality published during that time period to collect large scale data. This is a written record of not only all the deaths broken down by cause, but also where within the 130 parishes the deaths occurred, and exactly how many were caused by plague. Based on this data, they were able to show in great detail how the plague ripped through London during the summer of 1665 and then simmered for the next year before finally disappearing at the end of 1666 following the Great Fire of London. The plague was mostly gone by the time of the fire, but actually continued for several more months, so the fire didn’t contribute to its disappearance.
London weekly mortality register, September 12 – 17, 1665 (click for a larger version)
Mathematicians use the susceptible/infectious/removed (SIR) model to infer transmission and recovery rates during an epidemic. In the SIR model
- S = susceptible, the number of people who could be infected.
- I = infectious, those who are infected and are capable of passing on the pathogen.
- R = removed, those who have either recovered and are now immune, or who have died. In either case, these are the people who are now taken out of the susceptible population.
Using this SIR model, R0, the reproduction number (how contagious a pathogen is) is calculated. R0 essentially describes how many secondary cases can arise from a single primary disease case. If one sick person can spread disease to only one other person, then R0 = 1. If, on average, the disease spreads to 2 people, then R0 = 2 etc. For disease to spread through a population, R0 must be greater than zero, or there is not enough transmission to maintain the epidemic. To put this in perspective, influenza R0 = 1.5–3 and measles R0 = 17 (so get your kids vaccinated, parents! With an R0 like that, herd vaccination will only take you so far…).
Dr. Earn was able to calculate the difference between Black Death plague as it spread from Asia and through Europe in the following years: 1348, 1361, 1375, 1563, 1593, 1603, 1625, and 1665. What they found was that the R0 for plague actually rose over the centuries with an R0 = 1.1 in 1348 and an R0 = 1.5 in 1665. That translated to only 20% infection in the 14th century, but 50% infection in 1665 by the numbers. But they had to make one major assumption for this calculation: that the transmission rate in the second plague pandemic was similar to modern plague and the modern bacteria that scientists have studied. And knowing the historic death rates, Dr. Earn knew that assumption had to be incorrect since over 60% of the population was infected.
So what could account for this difference? And why did the plague spread nearly twice as fast in the 16th century, compared to the 14th century? We’ll never know for sure, but several possibilities exist:
- The pathogen itself may have changed and become stronger through mutations that were later lost when they no longer conveyed a survival advantage.
- Population density likely played a role as people started to live in dense clusters with close contact inside city walls.
- Climate change of the time also played a role, as the Little Ice Age occurred between 1300–1850 in Europe.
- What form of plague dominated at the time since bubonic had a much higher survival rate than either the septicemic or pneumonic variants.
So how does this information serve us in modern times? Dr. Earn cited the SARS pandemic of 2003 as an example. In Canada, we had 250 infections, from which 50 patients died, so a 20% mortality rate (which is quite severe in modern times with modern drugs). Worldwide, over 8,000 people were infected with 774 eventual deaths. However this pandemic could have been much worse but for a number of factors. China, the original location of the outbreak, reacted very quickly, and used extreme isolation of anyone diagnosed with SARS or who had come into contact with it. It spread through air travel to limited locations, with Canada being the next worst hit. I remember the SARS pandemic very clearly as our lab was located in the university hospital and coming to work every day included extremely long lines, written questionnaires, one-on-one health screening, and a single monitored entrance through the parking garage. But it was procedures like patient isolation and absolute dedication to stopping spread that halted the pandemic in its tracks and no infection has been seen since 2004. However, Dr. Earn calculated the SARS R0 = 2, which would have led to a 50% infection rate. In his estimation, had we not been able to control the outbreak, it would have quickly gone worldwide with over one billion dead. Simply stated, it would have changed the course of human history just as the 14th centuryplague changed the course of history after killing 50 million, just over half the population.

So this research is critically important. Mathematical models show that even if there had been a plague vaccine during the Great Plague of London that only protected 5% of the population, it would have made a significant change to the transmission curve and millions would have been saved. Using these tools, mathematicians will be able to assist during pathogen outbreaks as healthcare professionals are making decisions around treatment and vaccination and how to best protect the population and save the most lives. I’ve said for years that the bugs are going to win someday, but tools like this could stave off that fate.
Interested in more of what Dr. Earn and his team do? He gave a TEDx talk a few years ago, and this clip shows some of the fascinating animations he showed us last night about the spread of the Great Plague through the burrows of London:
Photo credit: Dr. David Earn, Lincoln’s Inn, Wikimedia Commons and Simple Wikipedia.

 COMPLETE!